
The future of shipping transfer pricing part 1. Preliminary considerations
Por (Autor) | Oct 14, 2020 |
Multinational shipping companies—without whom there would be far less transfer pricing—have their own transfer pricing considerations. Harold McClure looks at shipping multinationals and their interest in the changing landscape of international taxation under the OECD efforts to stem base erosion and profit shifting.
World trade grew from less than 15% of world GDP in 1970 to over 30% of world GDP in 2019. Tariffs and transportation costs are the key impediments to international trade with both declining over the last half century. Multinationals that produce goods in one region for distribution in other regions often rely on third-party shipping and logistics companies for the transportation of goods.
Shipping multinationals have an interest in the changing landscape of international taxation under the OECD efforts to stem base erosion and profit shifting. These multinationals often have their residencies in nations such as Liberia, Panama, and the Marshall Islands where the income tax rate is zero.
Under the international tax rules before the recent OECD efforts, any income attributable to the assets owned by the parent corporation thereby is not taxed. Pillar One focuses on intangible profits attributable to consumer-based intangible assets. Shipping multinationals have noted that such intangible assets do not exist for their businesses. Pillar Two would impose a global minimum tax. How this global minimum tax would impact the taxation of shipping multinationals is unclear given that the bulk of their assets is owned in jurisdictions in low tax justifications.
This article notes a few industry characteristics as noted by the International Chamber of Shipping (ICS) and other sources as well as revisiting a U.S. court decision involving a structure where U.S. Steel used a related party affiliate to ship iron ore from Venezuela in 1960. We shall suggest a few transfer pricing structures leaving the technical benchmarking issues for a separate paper on the future of shipping transfer pricing.
ICS on the Nature of the Shipping Industry
The ICS is the principal international trade association for merchant ship owners and operators, representing all sectors and trades with the various intergovernmental bodies that impact on shipping. ICS membership comprises ship owners in 35 countries representing over 80% of the world merchant fleet. The ICS has praised the existing OECD Model Tax Convention and the UN Convention as they relate to the operation of ships has served the global shipping industry well, and helps to facilitate very cost efficient transportation of the 90% of world trade that is carried by sea. The ICS notes that this tax framework provides the industry with a degree of stability that is necessary in order to operate in shipping markets that are subject to considerable short term freight rate volatility caused by continuous changes in demand for shipping services. The ICS also notes (see International Chamber of Shipping Preliminary Comments on Proposed Changes to the OECD Model Tax Conventional Dealing with the Operation of Ships and Aircraft in International Traffic and Treatment of Shipping in the UN Model Double Taxation Convention Between Developed and Developing Countries):
“Shipping is an inherently globalized business with over 60,000 vessels engaged in international trade calling at numerous different countries during a year. This is true of most ships engaged in bulk and specialist trades, as well as those carrying containerized cargoes. In the case of container vessels, they nearly always carry cargo from a number of different countries during a specific journey voyage…An ocean carrier’s service involves multiple ports of call and a plethora of international cargo origins and destinations on every single voyage.”
A Morgan Stanley discussion on the financing for shipping companies (Stefan Albertijn, Wolfgang Bessler, and Wolfgang Drobetz, “Financing Shipping Companies and Shipping Operations: A Risk-Management Perspective”, Journal of Applied Corporate Finance, Fall 2011) noted:
“Modern vessels are sophisticated assets that often require more than $150 million to build. And the global shipping industry generates an annual income of almost $500 billion in freight rates, representing approximately 5% of the total global economy. Shipping has also always been a volatile business, one that is tightly linked to the general business cycle. Shipping industry revenues followed booming world trade fairly closely up until mid-2008, with the Clarksea index of freight rates reaching a peak of 47,567 at the end of 2007. But as the global financial crisis spread and deepened in 2008, the index dropped almost 85% from its peak to a low of 8,025 in April 2009. And the market value of ships followed freight rates down, with the Clarkson Second Hand Price Index falling roughly 40% from a peak of almost 350 to below 200 … for shipping companies include freight rate risk, operating cost risks, such as bunker price risk, interest rate risk, and exchange rate risk, among others, as well as counterparty risk …Freight rates are the main source of income for a shipping company, and therefore the variability in earnings due to changes in freight rates constitutes the most important operating exposure. As a consequence, the volatility of freight rates has a direct impact on a shipping company’s profitability. The high volatility of freight rates is a major issue for all participants in the shipping industry. One explanation for the high volatility is that the demand for freight services is a “derived” demand—that is, a demand not for the vessel itself but for the services it provides. This demand depends on factors such as global economic activity, global seaborne trade, cyclical and temporal changes for commodities transported by sea, the distance between sources of production, and the consumption of commodities. The compounded variability of all these factors is reflected in highly volatile prices for freight services…The volatility of operating costs also affects a shipping company’s cash flow and profitability. Operating costs in a narrower sense include manning, repairs and maintenance, stores and lubes, insurance, and administration. Such costs are thought to be relatively constant and to rise with inflation. If the ship is operated in the spot (voyage) market, the ship owner also must bear all voyage costs. Most important, the cost of fuel oil (or “bunker”) typically accounts for 20-25% of the total voyage costs; and because it is linked to world oil prices, the cost of bunker fuel is quite volatile and hence a major source of risk.”
Payton Odom described this Clarksea index of freight rates and other measures including the Baltic Dry Index (“Shipping Indexes Signal Global Economic Trends,” Federal Reserve Bank of Dallas Globalization and Monetary Policy Institute 2010 Annual Report):
“The Baltic Dry Index (BDI) measures shipping costs for dry bulk commodities, including coal, grain, iron ore, finished steel and other metals, minerals and similar materials…A closer look into the methodology of the BDI reveals that index values may change even if underlying demand for capacity does not. Since the BDI approximates the prevailing rate for cargo space, the index may drop if excess space—added capacity for which no demand exists—comes online. This pattern occurs frequently in the shipbuilding cycle, as shipbuilders respond to high demand by ramping up construction of vessels, which require two to three years to complete. By then, demand may have diminished and these deliveries may not be needed. Additionally, shipyards do not adjust output quickly and will offer low vessel prices in a depressed market to unload excess inventory. This combination of delayed supply and prolonged periods of excess capacity causes shipbuilding cycles to last longer than broader business cycles. The BDI becomes especially volatile when supply and demand for shipping capacity change simultaneously, as occurred during the recent shipping bust. After a 2005–07 shipping boom, the BDI dropped 94 percent from May to December 2008 during the throes of the global financial crisis. In June 2010, the index averaged 2,375, a fourfold increase from the December 2008 trough, but still more than 2,000 points off the three-year average. From last May 25 to July 16, the index dropped from more than 4,000 points to just above 1,700, an almost 58 percent decline. Clarkson’s, a ship broker based in London, publishes weekly time-charter average earnings for all vessels in the container market, making it the most broad-based such measure of shipping rates.”
This publication showed both measure of shipping rates. Both measures indicated dramatic increases starting in 2003 with the advent of the commodity boom followed by dramatic decreases from 2008 to 2010 with the decline in trade due to the Great Recession.
A post entitled the Transport of Geography (https://transportgeography.org/?page_id=5619) shows the Baltic Dry Index from 1985 to 2019 and notes:
“The above graph underlines that the BDI has been very volatile in recent years, particularly between 2005 and 2009 when it behaved as a bubble. The main driver of this surge was linked to commodity prices, particularly oil. The index then plummeted back to historical levels and has remained weak in spite of a recovery in global trade. A factor is that many ships were ordered during the “bubble years” and have entered the market, providing capacity growth above demand growth. In recent years the BDI remains low, underlining a situation of excess capacity in the shipping industry.”
Another post (https://ar2018.scf-group.com/en/1/7/1) shows the Clarksea index from 1990 to 2019 noting:
“Despite the positive trends of 4Q, in 2018 the value of the ClarkSea Index amounted to USD 11,216 per day (the lowest value of the index was recorded in 1992 at USD 8,983 per day). Noimprovements were seen in the tanker markets during the period from December to September 2018. In addition to a decrease in demand for oil transportation due to OPEC countries exceeding their production cut targets (the actual cut in production in 1H 2018 was about 2.4 million barrels per day), the rates of new ship deliveries from shipbuilding yards were high in 1H 2018, including due toship delivery deadlines previously agreed between shipbuilder and shipowners who suffered losses having been brought forward from 2017.”
A common theme in both discussions is that high shipping rates during the commodity boom led to investment in new ships which continued even as an overabundance of shipping capacity contributed to the lower shipping rates even as global trade recovered from the Great Recession.
The Navios Litigation
U.S. Steel Corporation v. Commissioner was a 1980 decision involving shipping services. U.S. Steel established a Liberian affiliate called Navios to provide shipping services to itself as well as third parties U.S. domestic steel producers. U.S. Steel and third party steel producers purchased iron ore from Venezuelan mines. Navios charged the same commission rate to U.S. Steel as it charged to the third party companies. The court decision notes:
“In the tax years 1957 through 1960, Navios earned approximately $391 million in gross revenues, all on the transport of iron ore from Venezuela to various points in the eastern continental United States and in Europe. Of this total, revenues from Steel amounted to $286 million, or 73% of the total.”
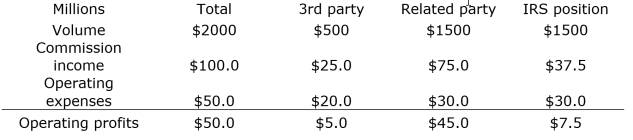
The court decision does not have much additional detail as to the underlying financials. The following table lays out a hypothetical set of financials consistent with the facts noted in the court decision where:
- Navios shipped $2 billion in iron ore per year with $500 million shipped on behalf of third parties and $1.5 billion shipped on behalf of U.S. Steel;
- Navios charged a 5% commission rate on both third party and controlled transactions; and
- Overall operating expenses were $50 million per year.
Let’s also assume that the market price of iron ore = $1000 per ton so this example assumes that the related party had Navios ship 1.5 million tons of ore while the third party had Navios ship 0.5 million tons of ore. Both parties paid Navios $50 per ton of iron ore shipped.
Illustration of Navios Transfer Pricing Issue
U.S. Steel Corporation v. Commissioner was a 1980 decision involving shipping services. U.S. Steel established a Liberian affiliate called Navios to provide shipping services to itself as well as third parties U.S. domestic steel producers. U.S. Steel and third party steel producers purchased iron ore from Venezuelan mines. Navios charged the same commission rate to U.S. Steel as it charged to the third party companies. The court decision notes:
“In the tax years 1957 through 1960, Navios earned approximately $391 million in gross revenues, all on the transport of iron ore from Venezuela to various points in the eastern continental United States and in Europe. Of this total, revenues from Steel amounted to $286 million, or 73% of the total.”
The court decision does not have much additional detail as to the underlying financials. The following table lays out a hypothetical set of financials consistent with the facts noted in the court decision where:
- Navios shipped $2 billion in iron ore per year with $500 million shipped on behalf of third parties and $1.5 billion shipped on behalf of U.S. Steel;
- Navios charged a 5% commission rate on both third party and controlled transactions; and
- Overall operating expenses were $50 million per year.
Let’s also assume that the market price of iron ore = $1000 per ton so this example assumes that the related party had Navios ship 1.5 million tons of ore while the third party had Navios ship 0.5 million tons of ore. Both parties paid Navios $50 per ton of iron ore shipped.
Illustration of Navios Transfer Pricing Issue
The IRS noted the high overall return to operating expenses, which they viewed as excessive. Shipping, however, is a capital intensive sector with volatile returns. For example, Yang Ming reported only $220 million in operating expenses in 2019 even though the value of its operating assets including assets owned and assets leased was approximately $4.25 billion. If the shipping market in 1960 was such that demand for this service was high relative to supply, shipping companies could be expected to receive significant returns to operating expenses.
The court accepted the taxpayer’s position that its 5% commission rate on the controlled transaction was supported by the 5% commission rate on third party transactions even though the IRS asserted that volume differences was a comparability difference. The IRS also suggested that the operating expenses in the controlled transaction may have been a lower percentage of volume shipped for the controlled transaction. This claim that there are some economies of scale for shipping is rather odd but perhaps one could argue that the third party shipping activity had to incur higher relative operating expenses than the controlled transaction because of differences in the amount of distance that they products had to be shipped.
While our table assumes an overall operating expense to total volume shipped equal to 2.5%, let’s assume the this ratio is 4% for the third party transactions and 2% for the controlled transaction. Under these assumptions, Navios received $5 million in profits on the third party transactions and $45 million in profits on the controlled transaction.
The IRS argued that the commission rate in the controlled transaction was excessive. Note that the ratio of commission income relative to operating expenses is 2.5 in the controlled transaction but only 1.25 in the third party transactions. Our table shows a possible IRS position based on setting the commission rate in the controlled transaction equal to 2.5%, which is 1.25 times the operating expense to volume ratio. This position would reduce the intercompany payment by $37.5 million per year.
Whether a 25% return to operating expenses for shipping and logistics services is consistent with the arm’s-length standard is an issue we shall explore in the next two sections. Shipping today is often carried out by third-party companies so the question of what represents an arm’s-length price for related party issue is not often relevant. Even if a company in the extractive sector did utilize related party shipping affiliates, market quotations for shipping prices are readily available.
Potential Transfer Pricing Structures
The transfer pricing structure for shipping and logistics can take on a variety of forms. For example, Sunny Kishore Bilaney note several litigation India involving logistics multinationals (“Transfer Pricing in the Logistics Sector,” IBFD Transfer Pricing Journal, July 2014):
“The logistics sector is broadly divided based on three types of services, namely warehousing, freight forwarding and transportation. These businesses are deeply interconnected, with some overlapping … Net revenue split: Under this pricing method, the net revenue collected from the customer (i.e. after deducting third-party costs, such as cost of local transport and freight charges paid to airlines and shipping lines) is split between the origin company and destination company based on an agreed ratio. In practice, it is observed that the net revenue is split in equal portions between the origin company and the destination company. This is based on the premise that the origin company and the destination company perform comparable functions, i.e. they coordinate with third-party service providers (such as clearing and forwarding agents, airlines and transporters; and companies assisting in loading and unloading the cargo) to provide integrated logistics services to their client. However, some logistics companies adopt a 70:30 split, whereby the group member that generates the business retains 70% of the net revenue and the remaining 30% compensates the counterparty for its functions.”
While the origination and destination affiliates are part of a global logistics multinational, the shipping company is a third party entity. Integrated logistics multinationals such as Yang Ming represent entities where the shipping company and these affiliates are owned by the same parent corporation. Even under the current nature of international taxation, the profits attributable to origination and destination affiliates are taxable. The Indian litigations involve the appropriate benchmarking of the profits attributable to the origination and destination affiliates.
The income attributable to the ownership of ships is highly volatile. In the last few years, low shipping rates have led to operating losses for shipping multinationals. If shipping rates eventually rise, then these multinationals may enjoy substantial profits with most of those profits captured by the entities that formally own the ships. The efforts under Pillar Two, however, may change the landscape of how shipping profits are taxed. One possible structure would be for the formal owner of a ship to charge the operating affiliate for the use of the ship. Under arm’s-length pricing, the operating affiliate bears the commercial risk of operating the ship while the formal owner receives a modest return to the value of its assets.
Both of these issues requires economic models to evaluate the appropriate profits for the affiliates of the logistic multinationals. In a subsequent article, we show how traditional transfer pricing approaches may assist in these evaluations.
This column doesn’t necessarily reflect the opinion of The Bureau of National Affairs Inc. or its owners.
Author Information
Harold McClure has been involved in transfer pricing as an economist for 25 years.
También te puede interesar

Effective transfer pricing in the Covid 19 era

Transferpricing 2020 Anual review

Getting ahead of the next Transferpricing challenge

Global transferpricing trends drive change